Final Project – Christina O’Farrell

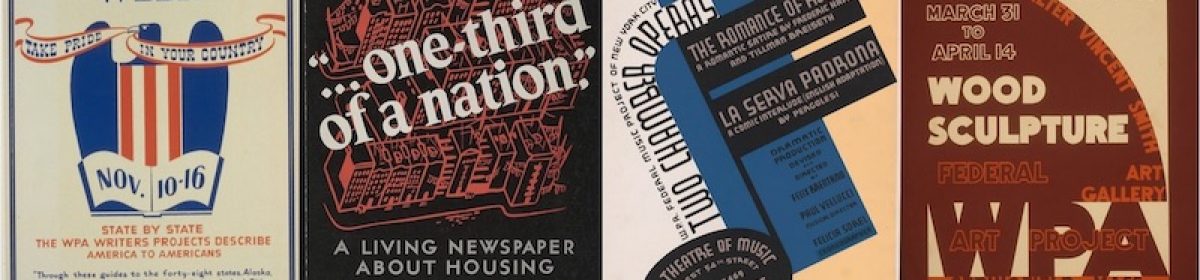
This semester, many digital tools that I had no idea existed were introduced to me. The specific ones we learned this semester helped me to promote my argument in my final exhibit, which was that the Federal Theatre Project influenced entertainment during the ’30s, especially with film. The tools I chose for my exhibit were image glitching, the timeline tool, and image analysis. My specific exhibit was definitely centered more around the visual aspect versus any kind of writing/word aspect. My exhibit was on the FTP and the film industry, which are both topics that require many visual aspects.

I chose to use image glitching for my first skill of my exhibit because it brought to focus more important aspects of the film and performance posters/photos. Glitching has been my favorite tool from this semester because it really transforms an image and helps you view it in a different way, usually a way you wouldn’t have expected it to transform into. 1

I chose to use the timeline tool because it helped to show the difference in the dates between the FTP and the films. It helped highlight the important times in the FTP and helped show that the two films were released after the FTP funded ended, proving my argument that these two were the most influenced films from the FTP.

I chose to use image analysis on my glitched photos because I thought it was important to analyze different parts of the two movie posters and photos. 2 It helped push my point that the advancement in film was to make potential audience members feel more involved and also see detail better, something that they were already able to experience during the FTP performances. It helped gain a better historical view, one could argue.

The history of the 1930’s was something that I wasn’t quite clear on. All I really knew was The Great Depression happened during this time and that was really it. I was able to learn about the literature, music, art, and entertainment of the 1930’s, something that never crossed my mind. 3 Learning that folk music was so huge during this time and that the song “This Land is Your Land” was released during the ’30s and the true meaning behind it was definitely a surprise. History classes only really teach about Herbert Hoover and The Great Depression when talking about the ’30s, so this class definitely gave me a better perspective of what the 1930s was really like. The 1930s really created legacies such as new technology, color in film, and the perseverance of American citizens during hard times.

This semester I was able to learn how to be an ethical citizen and pay more attention to copyright. 4 I never really paid attention to copyright, I just knew it was something to avoid, but I never knew what would classify as it or to even check if anything had restricted rights on it. When we had to do metadata for items we put in Omeka, it taught me a little bit about copyright and I was definitely looking out to avoid any items that had restricted rights on it. Also, learning to fact check everything was something I learned. The article about the professor from George Mason stuck out to me earlier in the semester, and then hearing him explain his story in person only made me feel better about constantly fact checking everything and making sure I have accurate information.

I would say one of the most important things I learned this semester was that using digital tools is a great way to learn history. It adds a different approach to history and helps you analyze in a different way. I almost feel like I learned more about history by using these interactive tools than I would have learned from a textbook.

Omeka exhibit.

Soundcite – Christina O’Farrell

The question I was aiming to investigate through sound clips was, “What was it like being an immigrant in the 1930s?”. I focused on immigration a lot this semester in different skill assignments we did because I felt like it was a very important topic to discover more on. Today, immigration is a very important topic and there’s a lot of unjust issues surrounding it, so I felt that trying to learn more about it in the ’30s was a good idea. Before investigation this issue, I had a guess in the back of my mind that being an immigrant to the United States during the ’30s wasn’t the best due to the Great Depression and all the other changes the country was going through.

One of the audio clips I discovered by Dominic Gallagher 1 was a lament of what it was like being a Irish immigrant. I had to google what “lament” meant and I discovered it meant sorrow and grief. Upon learning this, the song that Gallagher sang made much more sense. He sings of loneliness and the tone of his voice doesn’t have a happy sound to it. It almost sounds as if he’s in a bit of pain. This really made me think that his experience of immigrating from Ireland to the United States in the ’30s was not a pleasant one. This only proved the idea that I had in my mind before investigating.

Another audio clip that I discovered was one from an Italian immigrant, Victor and John Marinetti. The song is in Italian, so the lyrics aren’t quite clear, but the name of the song is “Italian immigration song” 2 The tone of the song isn’t very upbeat, it just sounds a little weary and just by that I assumed that the two singers were singing of struggles they encountered. Due to the song being called “Italian Immigration Song”, I figured it was a song about the issues Italians went through went immigrating to the United States.

None of the clips that I found seemed to have any uplifting songs or spoken word about positive experiences with immigration. It only proved the idea I had in my mind before. I also found it very interesting that two different groups of people, the Irish and Italians, both wrote songs of immigration to the United States. It reminded me a bit of the Federal Music Project 3 and I tried to find any similarities there. I remember learning in class about different songs that people wrote during the ’30s about traveling West and the folk songs 4 that came about there and that definitely reminded me of these songs.

I think by having the opportunity to add audio clips into this post, it provides more evidence of the point I’m trying to get across, which is that immigration in the ’30s was a struggle for people. Instead of having me go into thorough detail, the clip helps explain quite a bit.

Mapping Tours – Christina O’Farrell

This exercise helped me gain knowledge on different locations throughout the United States and how mapping places/things digitally is quite simple. It makes me question how people used to use paper maps vs. digital ones on phones or a GPS. It proved to me that the advance in digitalizing maps and directions has made a lot of people’s lives much easier, and this tool really proved that.

Mapping/spatial history can teach us about different locations/landmarks/etc that existed and might have been replaced by newer things today. A lot of the places I mapped from my Colorado Guide were small towns that have grown into much bigger towns or different small trails that aren’t found on maps because they are so small. It was interesting to realize how locations back then may have been a bigger location in the past, compared to how people value them now. If they’re not on a map anymore now, I translated that as it now being an important place anymore or just not existing.

View of trip from Denver to Boulder.

The trip that I found from the Green Book project ran through many locations in Denver, Colorado and even had a rest stop in Boulder, Colorado. The trip that I had mapped ran through Boulder and the surrounding towns near it, so seeing that this trip had a rest stop in Boulder made sense to me. Many of the points I mapped in Boulder were small towns or resorts, so I translated that as it was clearly a very residential city and so were the towns/locations surrounding it.

Segregation and racial bias affect tourism because different parts of the country are viewed as being more racist than others. It’s a stereotype that white people from the south may hold older views towards segregation and racism versus other parts of the country such as the north. If someone followed that stereotype, they might avoid being a tourist somewhere in the south. My friends that are POC have even expressed this to me saying that it’s something they do consider when they travel to different locations. The article, “Mapping Racism and Accessing the Success of the Digital Humanities1 was a really great read and lets people be able to view racism in a different way. Letting people see it through a map takes a different approach and also raises awareness.

Another project we looked at that really caught my eye was the Mapping Inequality project. 2 The key it used to describe whether a part of a city is doing well with racism or bad is really interesting. I think using a map view versus someone just typing something out about a city brings a more interactive approach and makes people more interested to learn more.

I think by using this mapping tool it allowed me to get a better sense of how the country valued different locations differently than they do now. Also, incorporating the different mapping tools that showed segregation and racism was a really great approach and I think it’s a great tool for teachers to use to teach students about racism.

Tour.

Works Cited:

Mapping Inequality.” Digital Scholarship Lab. Accessed November 17, 2019. https://dsl.richmond.edu/panorama/redlining/#loc=11/42.593/-87.82&text=intro.

Mapping Racism And Assessing the Success of the Digital Humanities.” History From Below, October 20, 2017. https://sarahemilybond.com/2017/10/20/mapping-racism-and-assessing-the-success-of-the-digital-humanities/

Special Collections – Christina O’Farrell

Getting to experience the Special Collections archive at Mason was a really cool experience. I had no idea that archive existed and that our campus has access to such great historical resources. The significance and role of the archive for scholars is to assist them in research that they’re doing, along with helping them gain more knowledge along the way. Many scholars do projects, so these archives are the best way for them to retain that information. The general public’s significance with archives is that many people have a general interest in archives, or some people have archives of their own to give to scholars. Museums such as the Smithsonian provides those in the general public who have an interest in archives a place to go and see a lot of different archives.

Archivists make decisions on whether to digitize materials on not based on their significance. If a certain material is in high demand, digitizing it is a great idea because it makes it more accessible instead of having a lot of people having to travel to a certain location to see it. This affects our interaction with the materials by changing the way it might look. Digitizing doesn’t allow someone to see the same features that one might see by viewing it in person. I think seeing materials in person is a better way to really experience the materials because you can pick up on so many more details.

My understanding of the FTP changed after viewing the materials we saw in class by giving me a better understanding of the different plays that people on along with how normal it was to take a lot of pictures of the actors. 1 I didn’t expect there to be as many pictures of the actors, the set, and the audience than there was. It made me realize that it was really important for people in the FTP to be able to document their plays and the entire experience of it all. I also realized how pretty their costumes were that they wore. I’ve been to a fair amount of plays nowadays, and the costumes in the pictures I saw had a lot more character and beautiful design to them. The materials my table evaluated was from Macbeth in Harlem, or the Voodoo Macbeth 2 I remember learning about that play in class, so getting to see materials from it in person was really cool. The costumes that the people wore were absolutely beautiful. Getting to experience the materials from the FTP really brought what we learned to life and I appreciated it a lot.

Works Cited:

“Federal Theatre: Melodrama, Social Protest, and Genius  :  Articles and Essays  :  Federal Theatre Project, 1935 to 1939  :  Digital Collections  :  Library of Congress.” The Library of Congress. Accessed November 12, 2019. https://www.loc.gov/collections/federal-theatre-project-1935-to-1939/articles-and-essays/federal-theatre-melodrama-social-protest-and-genius/.

“The Play That Electrified Harlem  :  Articles and Essays  :  Federal Theatre Project, 1935 to 1939  :  Digital Collections  :  Library of Congress.” The Library of Congress. Accessed November 12, 2019. https://www.loc.gov/collections/federal-theatre-project-1935-to-1939/articles-and-essays/play-that-electrified-harlem/.

Exploring Text Analysis – Christina O’Farrell

The historical question that I was aiming to answer was, “What was it like to be an immigrant in the United States, and what kind of jobs did they have?”. The assumptions I had regarding this question was that it probably wasn’t a super easy adjustment and that immigrants took on “odd jobs”.

I searched “immigrant” and “immigration” when I was trying to find sources for my question. I would look at the “Subject Headings” before opening the PDF and I would look to see if any specific countries were part of the subject headings, which they usually were, along with the word “immigration”. I knew once I found those two headings listed, that it was a good document for me to read and possibly download.

My experience using Voyant Tools was a bit overwhelming at first. When I first uploaded my corpus, it was a bit overwhelming to see the five different displays that popped up on the screen. However, I found that the “cirrus” display which showed the most popular words in the corpus, was very useful. I liked being able to see what words are repeated the most because it gives anyone a general idea of what the document will entail. The best way to describe Voyant is the way Miriam Posner described it. 1 The corpus I chose to upload and explore were ones that were about immigrants. There was about 12 files within it. Many of the ones I uploaded were people who were of Latino/Hispanic descent and I was able to identify that by looking at the last names. I’m Hispanic, myself, so looking for Hispanic surnames in the .txt file name wasn’t too difficult.

My assumptions changed a good amount by using these text analysis tools. I stated that I figured the immigrants had “odd jobs” when they arrived in the United States, but by using the text analysis tools, many of the reoccurring words on the “cirrus” display proved differently. One example was that one document was about a man named Joseph Captiva, from Havana, and he was a fisherman in Massachusetts 2 Just by using the Voyant Tools, I was able to disprove an assumption I had, which I believe is pretty helpful. Pairing my findings with other reading helped me to contextualize these ideas that I had found.

Joseph Captiva from Havana “cirrus” display.

Final conclusions I made about my historical question was that some immigrants when they came to the States during the late 1800s-1930s were able to acquire somewhat normal jobs. Their families were able to adapt well and refer to the U.S. as their home. I found the word “home” used quite often by using Voyant tools, which is another important thing to point out. Text analysis is a very useful tool that I plan to use again, especially if I’m doing any kind of research project. I think close reading is a lot easier to do versus distant reading, but distant reading requires less time. I view distant reading as “skimming” through stuff, which most people have done before. This assignment definitely helped me to learn useful ways to go over a document.

French stonecutter with Italian father’s “cirrus” display.

References

Banks, Ann. “American Life Histories: Manuscripts from the Federal Writers’ Project, 1936 to 1940, Introduction.” Library Of Congress, 1980. https://www.loc.gov/collections/federal-writers-project/articles-and-essays/introduction/

Posner, Miriam. “Investigating texts with Voyant.” Voyant Workshop, 2019. https://github.com/miriamposner/voyant-workshop/blob/master/investigating-texts-with-voyant.md

Oral History – Blog Post #5 Christina O’Farrell

The specific interview I listened to was with Fountain Hughes, a former slave, and he discusses what life was like after being enslaved. Thinking back to when I was in middle school history class, I just remember learning about who slaves were, the Civil War, and when the war ended, but never anything about the lives of the enslaved people after the war. These interviews really bring to life how enslaved people began to really live in freedom.

The timelines intersect very similarly. Historians would define the years that Hughes was enslaved as the Civil War era, but Hughes would define those years much differently because he was living during that time. On my timeline, the year 1845 was an important one to Hughes and to the country. Historians would look at 1845 and immediately think of Texas’ Congress voting for annexation to the U.S., but Hughes would look at it and know that was the year he began working as a slave. It’s just interesting how years have different meanings to different people, groups, etc.

I was surprised that Hughes never mentioned a marriage or any of his friends in the interview. He did discuss his family a bit, but he didn’t dive much into his friendships, especially his friendships after being freed. A part of me wanted to learn more about his relationships in Baltimore 1 and how well he settled in there after being freed. This interview, however, was very useful in painting a visual of what it was like being enslaved and their daily lives. The stories that Hughes told about the people he worked for and what he did for them really helped me imagine it more clear. Limitations of this interview might be the rambling that Hughes went on. Some of his rambling confused me a bit and he bounced from thought to thought a bit, but it’s understandable considering he said he was 101 years old during it. It challenged my view of oral history for sure. It proved to me that oral history can definitely help you learn more vs. written history (glancing at a textbook).

It was a bit hard to understand the dialogue at some points. 2 I could tell the recording device was quite old, but it did bring an immense amount of authenticity and a genuine feel to the oral history being told. Transcribing the sources wouldn’t be able to convey the emotion 3 that I could hear on the audio. Hearing the emotion let me identify what events were important to Hughes by the way he was talking about it.

This interview can show that in the 1930s, people weren’t afraid to talk about slavery and learn more about it. The interviewer in this specific interview sounded very respectful towards Hughes, which is something that wouldn’t have happened years prior due to the racism held in the country.

Norwood, Hermond, and Fountain Hughes. Interview with Fountain Hughes, Baltimore, Maryland. Baltimore, Maryland, November , 6, 1949. Pdf. https://www.loc.gov/item/afc1950037_afs09990a/.

“Slave Narratives from Slavery to the Great Depression : An Introduction to the WPA Slave Narratives : Articles and Essays : Born in Slavery: Slave Narratives from the Federal Writers’ Project, 1936-1938 : Digital Collections : Library of Congress.” The Library of Congress. Accessed October 24, 2019. https://www.loc.gov/collections/slave-narratives-from-the-federal-writers-project-1936-to-1938/articles-and-essays/introduction-to-the-wpa-slave-narratives/slave-narratives-from-slavery-to-the-great-depression/.

“A Note on the Language of the Narratives : Articles and Essays : Born in Slavery: Slave Narratives from the Federal Writers’ Project, 1936-1938 : Digital Collections : Library of Congress.” The Library of Congress. Accessed October 24, 2019. https://www.loc.gov/collections/slave-narratives-from-the-federal-writers-project-1936-to-1938/articles-and-essays/note-on-the-language-of-the-narratives/#note.

Timeline.

Interview.

Search Engine Bias – Blog Post #4 – Christina O’Farrell

If I was to give a definition of algorithmic criticism, I would direct someone to Cathy O’Neill’s to hear what she has to say about it. But, if I had to put it into my own words, I’d say it’s looking for the unbiased truth in algorithms. O’Neill’s TED talk was all about how algorithms are biased and how we can make our own algorithms with our own success. Scholars, such as O’Neill, have advised us (non-data scientists) to “demand accountability” from those data scientists who control the algorithms in our society. Those data scientists are the ones who set up the basic algorithms of the world, the algorithms that us, non-data scientists, have heard of, but they tend to turn out biased. The best thing to do is to try and avoid the biased algorithms and media that is presented to us.

Feminism impacted the 1930s by bringing to light the topic of equal treatment for women within the job force. More women had jobs during the ’30s, but the treatment they received was very different compared to the treatment men received. Another key thing to note that impacted the ’30s was the 19th Amendment passing and how some feminists believed their job was over. Women were elected to the Senate and FDR had women on his administration.1

In my opinion, I would say there are a few connections to draw between WPA-era activists and those today. Slavery/discrimination was an issue back during WPA and it’s still an issue today. I think today it’s much more prominent and the issues go deeper than those back then. People have more of an eye on biased situations compared to back then. Digital activists can spot bias quicker than WPA-era activists, especially in Noble’s article, Algorithms of Oppression. 2 The fact that digital activists were able to spot discrimination online through search engines blew my mind. It was something I would’ve never thought would show any kind of bias or discrimination, but I was wrong.

I believe techno-critics and algorithmic critics are applying the same ideas. They both are identifying bias’ and attacking them. They’re trying to encourage people to notice them as well and find ways to stop them. It’s a really interesting movement they’ve started by pointing out bias on search engines and other forms of technology, it really shows how much more we really need to progress to finally meet equality.

Moran, Mickey. 1930s, America – Feminist Void? Accessed October 20, 2019. http://people.loyno.edu/~history/journal/1988-9/moran.htm.

Noble, Safiya Umoja. Algorithms of Oppression: How Search Engines Reinforce Racism. New York: New York University Press., 2018.


Image Analysis & Glitching – Blog Post #3

I chose this image I wanted to do something based off women and The Great Depression. I have always read a lot about men losing their jobs during this time, but I haven’t seen much about women. I also found this specific poster very interesting because I wouldn’t have imagined that there would be any jobs being advertised for girls/women because there were barely any for men, and back then equality for men and women was far worse.

The image I chose reveals that during the 1930s, there were jobs for women. However, the jobs being advertised on the poster seemed to be jobs that were home jobs because it directly said “household employment”. It’s jobs that a woman that was a mother would regularly do at her own home. There’s two specific historical question that I’m asking while looking at this image. The first one is; Was being a maid during The Great Depression a normal job for a woman? It seem as if “household employment” is just a fancy word for being a maid and that’s why this question crossed my mind. An inference I can draw from this is that those were upper class must’ve been the ones advertising for “household employment” because they are the ones who could afford to pay a maid. The second historical question that crosses my mind is, how much were women paid during this time?

The methods used help people think more critically by really almost “challenging” the image. It really makes someone dive into the context and even make inferences. There’s only so much a poster or a image can really convey, but trying to rip off the surface level context and looking into what’s really behind it works with these methods. The site of consumption method was most interesting to me because I was able to put myself in the shoes of a woman in the 1930s and think about what I would think if I saw this poster hanging somewhere. It really puts you in the shoes of the audience during that time and I appreciate being able to see their perspective.

These methods helped me interrogate my historical questions by putting myself in the shoes of a woman in the 1930s. It made me think of questions that I would think of if I was a woman during that time and that I transferred that to a question nowadays I would ask. I wondered if women during the 1930s viewed “household employment” as being a maid, which lead me to one of the two questions I listed a few paragraphs above. The site of production made me really challenge the question, “What’s the real point behind this?” These methods helped me think critically and also think of “thinking critically ” questions.

Omeka item.

Omeka exhibit.

A New Way of Accessing Information

Obtaining information from a newspaper that is print compared to a newspaper than can be accessed online can provide a different experience. A print newspaper will give a person a more hands-on experience because they can feel the paper and possibly get more out of it. Reading a newspaper online could definitely be described as being more handy because searching key words or phrases has become easy. Tony’s presentation on how accessing information has changed over time is the reason behind these assumptions I have made. He brought in old newspaper dating all the way back to Salem in the 1600’s, which was very intriguing to see. Comparing that newspaper to the databases we have today has just proved how far society has come when it comes to digital technology.

Milligan’s hypothesis that more people will begin to read certain papers such as the Toronto Star because of databases is something that I can stand behind.1 I know for a fact that when I have accessed databases, I have used sources that I’ve never heard of or thought to use before. Another thing that was interesting from Milligan’s article was the fact that people have been citing more newspaper because of databases. After reading that, I came to my own conclusion that databases put forth more sources than a simple google search would. They basically open a more widespread and academic door vs. googling for a topic that one is doing research on.

Tony spoke briefly on digital projects and I formed my own opinion that I do believe they can create social change. I remember in class looking at own digital project that was teaching people about incarceration, but it really engaged the person and made them actually learn about the facts and troubles with it. Incarceration among many other things are some of the biggest social issues in the world today, so having a digital project that engages people but also has that ‘wow’ factor to it will really help educate people. 2 Hopefully by educating people, it’ll open a door for change. If someone does a project on a social issue, I really believe that somehow, change could come just by a few people being educated on that issue.

Milligan, I. (2013, December). Illusionary Order: Online Databases, Optical Character Recognition, and Canadian History, 1997–2010. Retrieved from https://muse-jhu-edu.mutex.gmu.edu/article/527016.

Blog post #1

I learned a lot from our first week of class discussions. I think one of the most interesting things that stuck out to me was the Radiophone Dance in 1920 because I always heard of Silent Disco, but knowing that the general idea of that goes all the way back to the 20’s was very interesting to me. Another thing that was really interesting to me was people’s amazement at the very first Mac computer. The reaction people had to something so simple was insane. Looking at the old Mac gave me a bit anxiety because I feel like I wouldn’t know how to use it compared to what Macs are currently. Nowadays, Macs are so easy to use vs. the way computers used to be. I never knew about all the commands people had to put into their computers to make it do specific tasks. I must say I am very relieved those coding/commands don’t exist anymore. Comparing digital technology back then to what it is today is mind blowing. I’m sure the people alive in the 20’s would have never dreamed of something such as “facebook” or “twitter” to take over their lives. I really hope to learn more about social media’s role with digital humanities along with cell phones such as iPhones. There’s so much to discuss when it comes to the cellphone, especially iPhones and Samsungs, etc. Learning how apps came to be would also be something I hope to learn this semester as well.

My project I was assigned was “Virtual St. Paul’s Cross Project” by NC State University. It will allow people to experience events that happened in London during the early seventeenth century. As of now, there’s only one phase completed for the project, which allows people to hear John Donne’s sermon for Gunpowder Day on November 5th, 1622 in the courtyard of St. Paul. The main goal behind this project is to show people how preaching used to be in London during the seventeenth century. As described by NC State, this project is”enabling us to experience a Paul’s Cross sermon as a performance, as an event unfolding in real time in the context of an interactive and collaborative occasion”.

The project was created by using architectural modeling software and acoustic simulation software, two kinds of software I’ve never heard of. Using Miriam Posner’s framework of sources, the way it’s processed, and presented, I was able to identify that the main sources of this project was using pictures from the seventeenth century of St. Paul’s Cathedral and also looking at the old documents of the specific sermons/events that happened there. The way this project was processed was it was very organized because of the many sections the website had along with many explanations. Finally, the project was presented by being web-accessible along with maps. My thoughts on this project is I think it’s an excellent way to engage people in history especially with the very interactive/realistic tools.

Works Cited:

“Virtual Paul’s Cross Website.” Virtual Pauls Cross Website, vpcp.chass.ncsu.edu/. Date Accessed, 3rd September 2019.

Posner, Miriam. “ How did they make that?” Miriam Posner’s Blog.Wordpress. Date Accessed, 3rd September 2019.

css.php