Beginning this assignment, I immediately knew what state I wanted to look at. Maine has always interested me, so I thought this would be the perfect time to get my feet wet. The tour I chose was Tour #4, From Fort Kent to Mattawamkeag. Now the focus of these tours was mobility and creating a good sense of the state for tourists. This tour intrigued me because it sounded mostly “off-road.” Trails and canoeing down rivers were always mentioned at some point along the way. This tour was not for the faint of heart; rather, it was for those seeking sport. There was no road to simply drive down and sightsee, this route went through the woods and often junction with State Route 11 at certain points. I interpreted this as the writers wanting to show off the wilderness of the state, show what fun it has to offer in lush scenery and hard-working people.
The interesting thing about the tour is that it runs north to south almost in a straight line. Marguerite Shaffer’s See America First: Tourism and National Identity, 1880-1940 states that the federal workers wanted the tours to not be cyclical, but to go in the cardinal directions from state border to state border. 1
This tour offered many surprises when compared to the Negro’s Green Book project which compiles data about trips blacks took to safe spots for them in the past. Being that this tour was organized by the government and carried out by the state and local governments, this tour was mostly in the hands of White Americans.  This image, screenshotted from Google Maps shows the general path of the Fort Kent-Mattawamkeag Tour. While traversable today, White Americans would most likely have enjoyed the thrill of the sporting events (hunting game and fishing) and taking to the wooded trails and canoeing.
 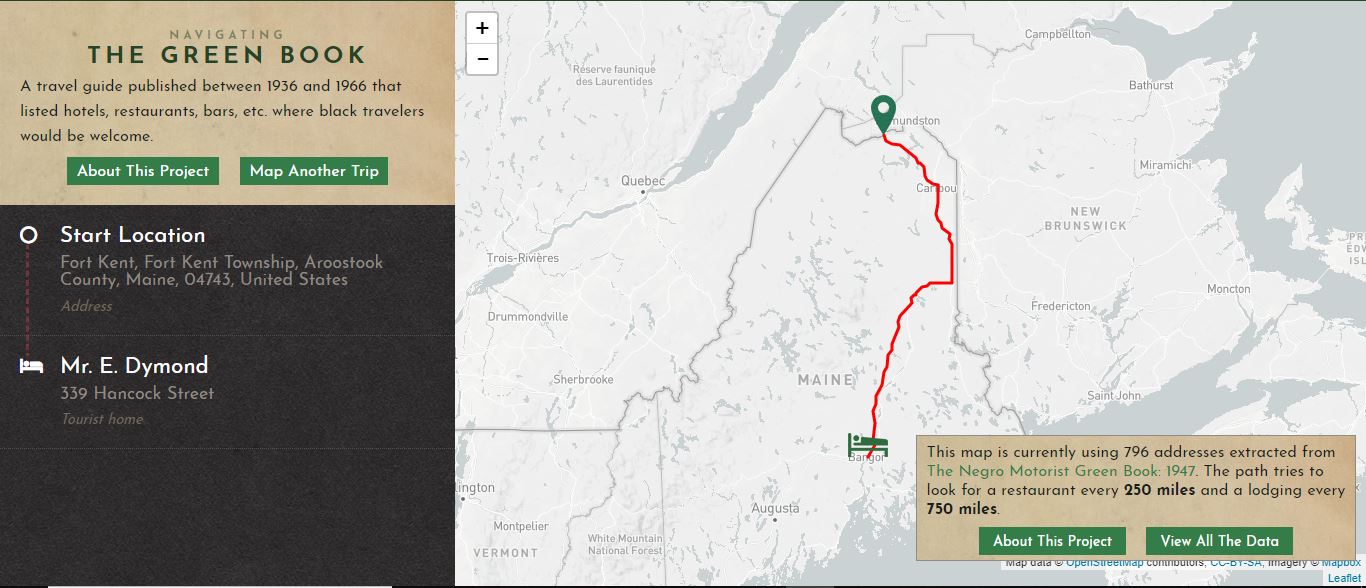 This map, created from The Green Book‘s data in the year 1947, shows a path that does not line up with the tour. What I feel this shows is that they (the Blacks at the time) would not travel through the forest trail or down State Route 11 to get to Bangor. This shows that these small towns might not have held the same importance to White Americans as it did to Blacks. Here, I think a historical bias could be drawn, but something else needs to be looked at first.
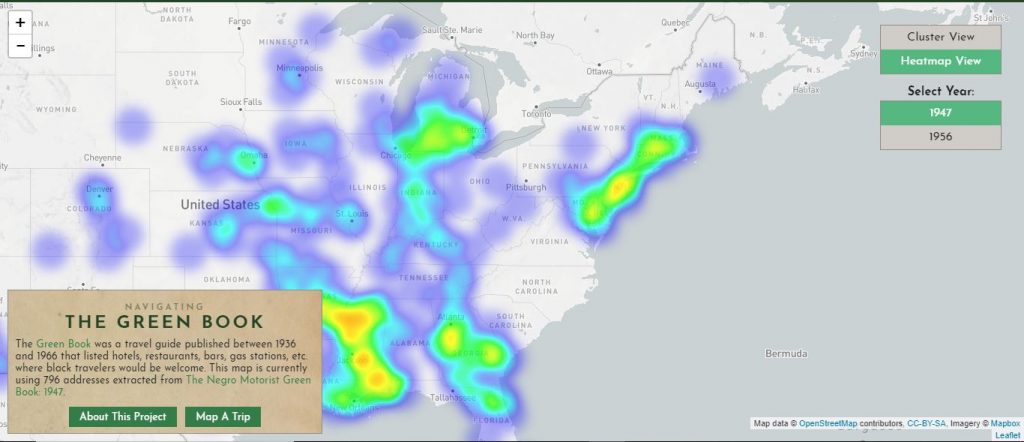
Using this heat map, it is easy to see that Blacks in Maine was not a common occurrence. There was only one rest stop available for them in the city of Bangor and not much else. No matter how I planned the trip, everything always ended back up at Bangor. So, concerning the historical bias 2 of the tour, nothing really reflects a racist attitude towards blacks as they were not a heavy presence. A lot of the major cities like New York, Chicago, and Atlanta are more densely populated by such locations that it makes sense as Blacks were more common to those regions.
By taking these tours and analyzing them both digitally and spatially, the goals of the FWP in writing the guides become apparent. Maine is rich in wildlife and game, making it a choice place to visit for hunting, fishing or for beginning a lumbering industry. The concept of wanting quasi-linear tours is also apparent. Maine has it all to get tourists coming to its forested frontiers. In a similar vein, The Green Book shows the racism of the times and the places blacks could go. It evinces a sense of a broken nation that really clashes with the goals the New Deal Administration wanted to bring in.
- Shaffer, Marguerite S. See America First: Tourism and National Identity, 1880-1940. Smithsonian Institution, 2002.
- Jr, Vincent S Artale. “Mapping Racism And Assessing the Success of the Digital Humanities.” History From Below. October 20, 2017. https://sarahemilybond.com/2017/10/20/mapping-racism-and-assessing-the-success-of-the-digital-humanities/.