
The guidebook I chose for this mapping assignment was “California: A Guide to the Golden State”. All of the options were within the United States. After looking through all of the options I thought California was my best option because we have learned about this specific state before, and how migrants traveled to California seeking new and better job opportunities. In the article “The Migrant experience” they mention why people left their homes and fled to California.”Driven by the Great Depression, drought, and dust storms, thousands of farmers packed up their families and made the difficult journey to California where they hoped to find work.” 1. A reason migrants came here was because of the nice temperatures allowed for a long growing season. However, Californians experienced the depression too so it was not as great as all the migrants thought it would be when arriving.
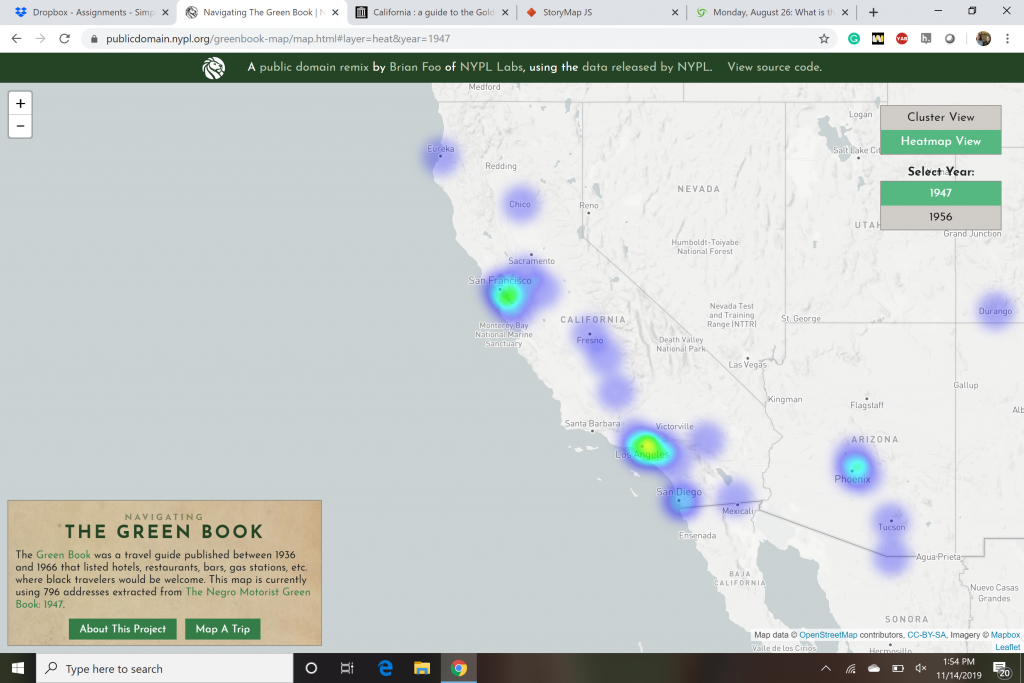
The tour I created from the guidebook was “Tour 5”. This tour passes through some key tourist sports in California, such as Lassen Volcanic National park, McCarthur Memorial State Park, Summit Lake, and many more. This tour focuses a lot in the northern part of California near places like Reno, Lassen, and the Plumas. It goes through all the popular spots for people to tour in this area. I compared my map to a heat map in the green book. In the California area in the green book, they had found 76 spots for where either restaurant, hotels, bars, or gas stations would be. I wanted to focus on the northern part of this map so it was comparable to my map. Once I started looking closer to the upper half of California there were about 17 spots marked. A lot of these places were hotels and tourist homes where people could stay for however kong they needed. Whereas my map mentioned a lot of lakes, gas stations, or national parks; it never really mentioned any tourist homes or hotels so that was one big difference I saw. Another difference I saw was the location, my map had a lot more spots in northern California, but the heat map only had a few and was focused more on the southern part of California.
Next, I want to briefly talk about how the experiences of black and white travelers are different or similar. I noticed that many of the icons that I looked at led me to a “The Negro-Motorist Green Book”. This makes sense because it is what the Green book is about. However, you could assume that the places black people had to stay were more run-down and not as nice because of the time period. Both races had many options for places to go, however, some of them were strictly for black people so that they were separated from white people. So there was some obvious segregation in that way. The maps did not give me much more information about racial bias and segregation in 1947. In the article “Mapping Racism And Assessing the Success of the Digital Humanities,” they talk a lot about how “people of color” have been using maps to visualize racism. “Many prominent African-American activists at the time turned to maps and other data visualizations in order to help the public–and even the president–to understand the detrimental effects of slavery on the country.”. 2.
Mapping and spatial history can educate us a lot about the past. From this assignment, I have learned about how we can see racial bias from a map which I really did not know was possible. This exercise also taught me about how we can view these primary sources in different ways just based on how they are spatially set up and they are telling us. For example, in the heat map, I was able to tell where things were located and what areas had more places marked than others. Certain cities had more hotels or restaurants than the next which would affect the population and amount of tourism in that area.
https://storymap.knightlab.com/edit/?id=a-guide-to-the-golden-state
- “The Migrant Experience”, Library of Congress, accessed November 17, 2019, https://www.loc.gov/collections/todd-and-sonkin-migrant-workers-from-1940-to-1941/articles-and-essays/the-migrant-experience/
- “Mapping Racism and Assessing the Success of the Digital Humanities”, History From Below, accessed November 17, 2019, https://sarahemilybond.com/2017/10/20/mapping-racism-and-assessing-the-success-of-the-digital-humanities/