Final project

My final exhibit is focused on how the perspectives of women have changed throughout the 1930s. I chose this topic because a lot of things happen during this time that allows women to start working and becoming involved in the economy. Several things I will talk about in this post are women in the industry, migrant women, and how they became involved in employment along with many other topics. This post will also include multiple secondary sources that give me background information on my historical question. Lastly, I will go over the digital tools that helped shape my historical question.

The first page of my exhibit, not counting the introduction, is titled “women in the industry”. The digital tool I used on this page was annotated image. This was an important tool for me because I am able to explain my topic to the audience through an image. The picture I chose shows off the women’s skills and how they are capable of doing complex jobs. However, back then it was much more difficult for women to become noticed. During the great depression, women had to try and find jobs because they needed to have enough money to support their families; their husbands could not be the only ones working. The “American Yawp” does a great job of explaining the great depression and how it affected these families. ” the most desperate, the chronically unemployed, encamped on public or marginal lands in “Hoovervilles,” Poor women and young children entered the labor force.” 1.

My second page is focused on migrant women and what their roles were as women during that time. Glitching was the digital tool that I used for this page. I used the famous photo titled “Migrant Women”. In my opinion, this photo was detrimental to this section of my exhibit. I chose glitching because it allows you to look at an image in a way you never thought you could. Through the glitch, I was able to focus on her face which showed great desperation for the future. She looked as if there was no hope left. Many of these families had to migrate to California because of the effects of the dust bowl. They also believed farming in California was more successful which allowed them to make more money. ” This increase in farming activity required an increase in spending that caused many farmers to become financially overextended.” 2.

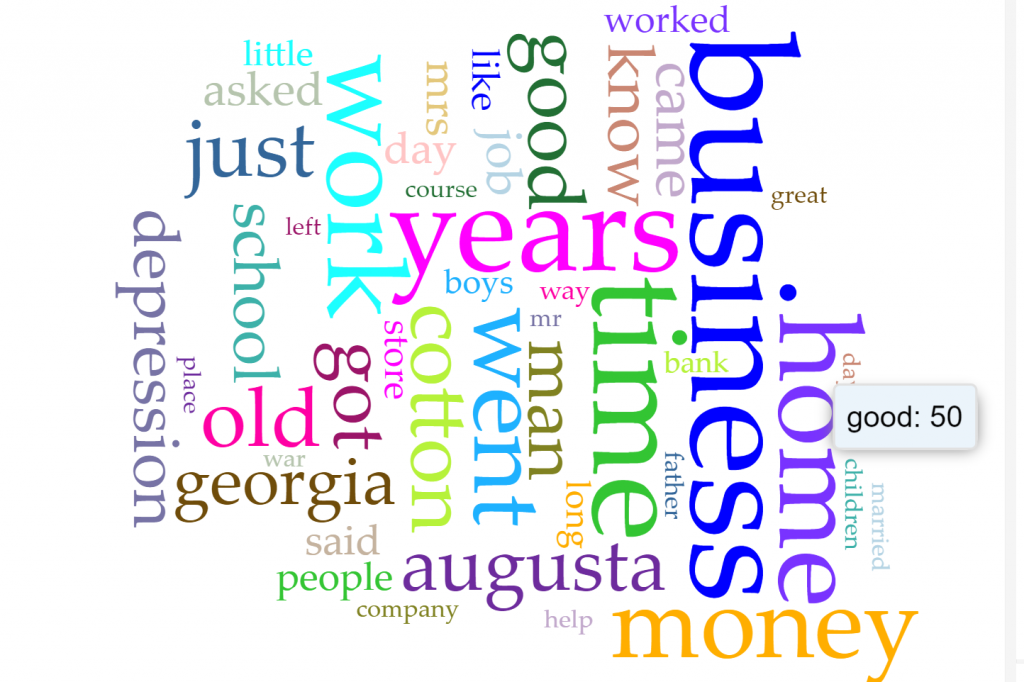
On the third page of my exhibit, I used text analysis with the digital tool voyant. “Voyant is a web-based tool for text analysis that is designed to combine ease of use with a sophisticated array of visualization methods.” 3.

I analyzed several interviews of women working in New York after the great depression. I wanted to be able to get an idea of what their careers were like before and after the great depression. However, when I looked at the cirrus it was missing some keywords that I thought would show up, such as women and careers. One word that I did find was “Mrs” because they were mainly referred to as their last names. Since the cirrus was not much help I had to try and look closer into the interviews. I was able to find a pattern that was quite unfortunate. I was able to conclude that several of the women struggled to find jobs because they did not hold as much value as men did at the time. A few of them even got into prostitution just to help support their families. At that time we can tell that the perspective of women then was not positive or uplifting. Once the New Deal was established, more jobs became available for women. “the New Deal encouraged a widespread effort among Depression-era Americans to work together to improve their situation and to recognize that America was, a “nation of nations.”. 4.

In conclusion, I learned a lot about the history of the 1930s in this class and the importance of being productive and ethical digital citizens. Before this class, I was uneducated on all the tools we used and learned about. Now I am able to understand the history of the 1930s with a digitized background. I believe that everyone should be educated on the tools we use because they are able to provide a lot of information and increase our knowledge as digitized citizens.

Exhibit link: http://jessicadoeshistory.com/cnd/exhibits/show/perspectives-of-women-in-the-1

Mapping California

The guidebook I chose for this mapping assignment was “California: A Guide to the Golden State”. All of the options were within the United States. After looking through all of the options I thought California was my best option because we have learned about this specific state before, and how migrants traveled to California seeking new and better job opportunities. In the article “The Migrant experience” they mention why people left their homes and fled to California.”Driven by the Great Depression, drought, and dust storms, thousands of farmers packed up their families and made the difficult journey to California where they hoped to find work.” 1. A reason migrants came here was because of the nice temperatures allowed for a long growing season. However, Californians experienced the depression too so it was not as great as all the migrants thought it would be when arriving.

The tour I created from the guidebook was “Tour 5”. This tour passes through some key tourist sports in California, such as Lassen Volcanic National park, McCarthur Memorial State Park, Summit Lake, and many more. This tour focuses a lot in the northern part of California near places like Reno, Lassen, and the Plumas. It goes through all the popular spots for people to tour in this area. I compared my map to a heat map in the green book. In the California area in the green book, they had found 76 spots for where either restaurant, hotels, bars, or gas stations would be. I wanted to focus on the northern part of this map so it was comparable to my map. Once I started looking closer to the upper half of California there were about 17 spots marked. A lot of these places were hotels and tourist homes where people could stay for however kong they needed. Whereas my map mentioned a lot of lakes, gas stations, or national parks; it never really mentioned any tourist homes or hotels so that was one big difference I saw. Another difference I saw was the location, my map had a lot more spots in northern California, but the heat map only had a few and was focused more on the southern part of California.

Next, I want to briefly talk about how the experiences of black and white travelers are different or similar. I noticed that many of the icons that I looked at led me to a “The Negro-Motorist Green Book”. This makes sense because it is what the Green book is about. However, you could assume that the places black people had to stay were more run-down and not as nice because of the time period. Both races had many options for places to go, however, some of them were strictly for black people so that they were separated from white people. So there was some obvious segregation in that way. The maps did not give me much more information about racial bias and segregation in 1947. In the article “Mapping Racism And Assessing the Success of the Digital Humanities,” they talk a lot about how “people of color” have been using maps to visualize racism. “Many prominent African-American activists at the time turned to maps and other data visualizations in order to help the public–and even the president–to understand the detrimental effects of slavery on the country.”. 2.

Mapping and spatial history can educate us a lot about the past. From this assignment, I have learned about how we can see racial bias from a map which I really did not know was possible. This exercise also taught me about how we can view these primary sources in different ways just based on how they are spatially set up and they are telling us. For example, in the heat map, I was able to tell where things were located and what areas had more places marked than others. Certain cities had more hotels or restaurants than the next which would affect the population and amount of tourism in that area.

A heat map of California

https://storymap.knightlab.com/edit/?id=a-guide-to-the-golden-state

Blog post 8

In our visit to special collections last class we got to explore certain objects, pictures, clothing, etc. I have never heard of special collections before; I didn’t even know it existed, so this trip was very educational for me. It was very interesting to see all the different types of special collections and the values that they hold. For example, my group looked at a file of how portable theatres were beneficial to places that did not have their own theatres. This is just one special collection of thousands that exist. I really enjoyed looking into it.

Archivists play a very important role in special collections. In the interview titled “Bias, Perception, and Archival Praxis” with Thomas Padilla and Elvia Ramirez, they talk a lot about the importance of archives. Elvia says, “Archival work requires an ethics of care for the deeply personal and the deeply political.”. 1. This interview lets us know all that work that goes into the archival process. First off, archivists are someone who assesses whether a given piece of information is of value, then maintains and stores the information in the appropriate manner. Secondly, they have an important job of deciding whether a material should be digitized or not. They decide this by first seeing if the material can even be digitized, some objects that are more 3D like are not meant to be digitized because it takes away the meaning. However, digitizing a certain collection or material can make it much easier to access and explore. The con to digitizing is that with most items, you cannot get the full experience online. An archivist must decide that if the item is digitized, will it lose value or not. In the article by Susan Manus, “the Artifactual Elements of Born-Digital Records” she talks about the importance of preserving content and material. She says “while preserving the informational content of born-digital material requires its own distinct processes, preserving the artifactual elements of digital records a unique set of intellectual and technical challenges.”. 2.

The materials we reviewed in class provided me with information for the period of the Federal Theatre Project. It made me consider where the data came from and how it gained its importance. The documents that my group looked over help me gain knowledge on why they wanted the portable theatres to exist and why the encouraged it to happen. These small portable theatres were funded by the FTP and helped people gain interest in certain entertainment. I also learned from the sources the physical data differs from digital data, and that physical date is better because we are able to interact with it in person.

Text analysis

For this project, I decided to use my own corpus, which is the 10 files that relate directly to my historical question. My historical question is, “How did the aftermath of the Great Depression affect the people who lived during it”. Through this question, I was able to find several files that matched up well with this topic and gave me a great insight into my question. However, I chose to compare it to the class corpus as well to try and be and visualize the similarities and differences between both of the corpus.

The American Yawp gave me great insight into the great depression and how it affected everyone’s lives. They talked about how it affected the market directly by saying, ” The market temporarily stabilized but fears spread over the weekend and the following week frightened investors dumped their portfolios to avoid further losses.”. 1 “The Great Depression” American yawp. http://www.americanyawp.com/text/23-the-great-depression/2. This quote helped me narrow down what I wanted to do for my distant learning even before I had used Voyant tools. The podcast on Hoover, who was president at the beginning of the great depression, talked about what happened to people after the market crashed. “Nearly half of its banks failed, nearly a quarter of its workforce out of a job.”. 3 “The Memory Palace”, Podcast, http://thememorypalace.us/2017/10/hoover/ . This led me to decide what I wanted to look at in my corpus. What I immediately noticed within my corpus was the word business. It was easily the biggest word on the Cirrus image. I was able to find that the word business was mentioned over 100 times in all of my files; this led me to do my distant learning based on this word because all of the other words were smaller and did not hold as much importance. When looking through where the word business fell in my files I found a pattern. Every time the word was mentioned it was either that the person owned a business, worked within a government entered business, or just were apart of a standard business. Several people had lost or closed their business as soon as the stock market crash while others did a few years later. For example, in one of my files titled “Honest and Fairness to the Bitter End”, a man had to close his business in 1936, seven years after the stock market crash. He had mentioned that people have tried to help him keep it open, but nothing was successful. I was surprised that he was even able to keep it open for a whole seven years. Secondly, I saw that many people had mentioned that after the stock market crash the government promised that businesses would resume but most of them never did.

My last step was comparing my 10 files based on my historical question to the large class corpus. First off, there was a larger amount of results in the class corpus because there were 300 more files. I was surprised to see that in the larger corpus I could not even find the word business in the cirrus. I thought I would for sure see the word business but I could not find any information on it. The biggest word in the larger corpus was “resources” and it was mentioned almost 2000 times; compared to the largest word in my corpus which was only mentioned about 100 times. Secondly, the trend graph for both of the corpus was drastically different. The class corpus trend graph was much more congested and harder to visualize. Whereas my corpus trend graph was easier to understand and pick out certain themes. In conclusion, I was able to compare both of the corpus and how we can learn to distant learn from a little information to a larger amount of information.

Citations: “The Great Depression” American yawp. http://www.americanyawp.com/text/23-the-great-depression/

“The Memory Palace”, Podcast, http://thememorypalace.us/2017/10/hoover/.

The class cirrus of the 322 files.
My cirrus of the 10 files I had chosen.

Laura Smalley

Laura Smalle suffered as a slave throughout her childhood, however, she does not talk a lot about the abuse she received. It seems like those memories were farther away from her and she did not like to bring them back into her current life. In part 5 of the interview, Laura mentions that colored people would get beat up. The interview asked if they still did and she said, “They do not beat them up so, so bad like the use to.”. 1. She then goes into talk about how she was scared but never mentioned any direct abuse. However, we can imply that she was because she says ” But there ain’t nobody never have bothered me since I’ve been here, and none of my children. “. From this interview, we can also learn about how slave children were treated. Their parents obviously really cared about their children, but they could not really prevent them from being badly treated by others. They would receive “whoopings” from their owners. She also mentions how women received a great number of beatings. For example, in the interview, she tells the story about a plantations mistress who beat a woman slave in the “peach orchard garden” and she says they “snuffed out a pipe on her skin.”. 2. Through these stories, we can see how many bad experiences that the enslaved men, women, and children faced for a very long time.

Throughout the interview, I learned that most of the enslaved people did not hear about major monumental things that happened in history when they were enslaved. If they did hear, it was much later than everyone else. Laura brings up a very interesting example of this that I was surprised to read. She said that when the Civil War ended that she and all the other enslaved people were unaware that it happened. Their master failed to mention that they had been freed until a whole six months after. Historians categorize the past on these specific events, such as the Civil War, Reconstruction, or Worl War 1, etc. Historians always mention the monumental moments and mainly the great things that happened in the past. They tend to generalize the events whereas personal timelines go more in-depth. When Laura talked about her past she failed to mention any big moments in history when she was enslaved; probably because she was not aware of most of them. She tended to focus on the smaller events that happened to her and enslaved people.

The most surprising moment to me is when I learned that she did not know she was freed until six months later after the Civil War had happened. That is one thing that I never thought about that effected the enslaved people. They do not have much access to the outside world. I was surprised that they left out specific days and events. I could not really get a great grasp off of when certain things happened. The usefulness of this interview is that we were able to learn about enslaved people through one person. We could experience her enslaved life through the oral interview. I also like how we can hear her reactions to certain events that happened to her; it allows us to be more in touch with her emotion. One limitation that stood out to me was trying to understand the interview. When I would go to listen to the quality of the interview would be pretty bad at some points that I could not even understand what they were saying. It confirmed that oral history interviews may be hard to transcribe because of the quality that was used back then. I was able to look at the pdf files which was helpful, but even the transcriber for that was unable to fill in everything they said. I also had trouble with certain dates. However, I was able to guesstimate the years that things happened base on some of her answers in the interview. For example, in one section she mentioned the Civil War; so I was able to find a somewhat accurate date for that time in her life. She never mentioned specific years but she did mention how old she was at a few times in the interview. This helped me distinguish between certain events and how far apart they were which was helpful.

I believe this interview was comfortable for Laura. They did not seem to ask too many questions to the point that it would overwhelm her. The FWP treated the interview as if it was a normal conversation. Turning the interview into a conversation allowed Laura to open up more and go into depth about her past life. To me, this shows that the Federal Writers Project had the best intentions in all of their projects and wanted people to feel that they could be as involved as they chose to be.

Timeline link: Here is the other link since the embed link would not work.

https://cdn.knightlab.com/libs/timeline3/latest/embed/index.html?source=1lAR_lIdLA1IZaAc3hWy9X0D2Uy6bMJTJq8QOFmsLMrc&font=Default&lang=en&initial_zoom=2&height=650

Critical response to digital technologies

The Long Civil Rights Movement (LCRM) had a big impact on the 1930s. In Jennifer Ritterhouse’s ” Discovering the South: One Man’s Travels Through a Changing America in the 1930s. “. She does a great job describing the LCRM. In this introduction, she mentions Jacquelyn Dowd Hall. She “outlined a LCRM framework that is longer, broader and deeper.” 1. The Long Civil Rights movements in several ways. It took root in structural changes and political possibilities of the last 1930s. These changes accelerated during World War two, as well as stretching far beyond the South. It was also reshaped by the Cold War and was continuously and extremely contested. There are many Algorithm critics and they have many reasons to be critics. As Louise Matsakis’ says in the article “What does a fair algorithm look like” he mentions many downsides. For example, “algorithms can be sexist, racist and perpetuate other structural inequalities found in society. “2. However, algorithms are not under any obligation to explain themselves. This causes much other bias. Many machine experts, technology companies, and event governments have called for more fairness and transparency in algorithms. As scholars have mentioned, many people struggle to agree on what constitutes a fair explanation for these algorithms. Matsaki also mentions that even lawmakers have not been able to decide what rights citizens should have when it comes to transparency in algorithmic decision-making. Another reason algorithms do not seem to be fair is because they offer more achievable resources to wealthier people, younger and people, and men. Therefore, women, elders, and people who make less money have fewer options for resources. Matsaki gives a great example of this. He says “A woman might need to lose far more weight for a health care AI to offer her a lower premium rate than a man would. We could participate better in digital media by creating a simple understanding for everyone. Many people do not think about certain codes for algorithms, just the particular reasons for the decision. In my opinion, if people were educated on this topic than they could become more involved in digital media. I had trouble finding connections between WPA-era activists and contemporary digital activists. I can say that the activists are both passionate about what they are or were trying to achieve. WPA’s main goal was to employ job-seekers and carry out public works projects. While digital activism focuses more on the internet and digital media as key platforms for mass mobilization and political action. They do both have a connection to the political side of things but other than that since they occurred at times it is complicated to find several key connections.

Ritterhouse, Jennifer. “INTRODUCTION: The Same Journey, Writ Small, That the United States Was On.” In Discovering the South: One Man’s Travels through a Changing America in the 1930s, 1-19. CHAPEL HILL: University of North Carolina Press, 2017. http://www.jstor.org.mutex.gmu.edu/stable/10.5149/9781469630953_ritterhouse.4.

Louise Matsakis’, “What does a Fair Algorithm Actually Look Like”, accessed October 10, 2019, https://www.wired.com/story/what-does-a-fair-algorithm-look-like/?

Glitched photo

The image I chose for this assignment was of a woman during the dust bowl in her living environment. I chose this image because I am very interested in the Dust Bowl and how they lived through it back then. I also remember learning about this in high school so seeing this picture really sparked my thoughts on the dust bowl. This photo is only of one person but has a lot to it, so I feel that I am able to write a lot about it. Glitch art is figuring out that these faults in the images are actually false. I agree with this statement because glitched images are compelling and exposed. You are able to create your own voice through an image and make it whatever you believe it to be. The “Art of glitch” youtube video mentioned that these “new tells are supposed to become a seamless way for us to express ourselves”.1 Through learning this I was able to make assumptions about the image; I was able to open up and really think about what the glitched image could mean. It was very interesting going over several of the glitched images I saw, but I was able to narrow it down to one. I was able to ask two historical questions. The first question I asked is “What were the living conditions like in the dust bowl”. My second question was “How were people feeling during this time?”. Using the principles of image anaylsis I was able to search through the photo and make assumptions using the methods. The image turned into the lady’s body being glitched along with the environment behind it, but you could still somewhat make out what she looked like. Her clothing stood out to me as well, especially her sweater. So you could still see her clothes were dirty. In the article “Glitching History”, Kramer mentioned when a photo is glitched it can spark a heightened awareness and that’s what I believe the glitch did to this photo.2. The method in image analysis that talks about the site of the image itself is the most helpful to the photo I chose; it helped me answer my historical questions as well. I was able to figure out what the conditions were like and how the people were feeling in this horrible situation. I was able to draw that the living conditions were not very good, in the photo you could see lots of dust and even the filth in the air. Also, I could tell how people felt through the women’s facial expression before the glitch and how her body was positioned. Through this method, I was able to use visual meanings to make opinions on what I think the glitched photo is expressing. The site of consumption was able to help me make stronger interpretations as well. My interpretation is that the image still wants you to know who the woman is but, in my opinion, is wanting you to forget her living environment and focus more on her. I think the photo is expressing how the woman is living and how she is feeling without the context clues of the rest of the photo. The reason for this is so you can understand what the woman is going through and how she is living through this time. Being able to see her sweater and the filth in it helps people understand that it was not just her environment that was ruined, but the majority of her belongings as well. In conclusion, I think making interpretations of a glitched image is very interesting because everyone can have different conclusions on the same glitched image.

http://jessicadoeshistory.com/cnd/exhibits/show/dustbowllivingconditions

http://jessicadoeshistory.com/cnd/items/show/148

Blog post 2

I found Tony Guidone’s presentation to be very interesting and educational for this class. Text searching definitely makes looking up or researching certain topics much easier. For example, when I go to type in a keyword to find something I could receive thousands of responses to help me narrow down what I am really trying to find. However, as he discussed in his presentation, there are several methodological problems that come with digitization. First of all, it creates unnecessary hierarchies. He asked the question “does Toronto star deserve to be cited 900%?” the answer he was leaning towards was no. Ian Milligan’s article “Illusionary order” also mentioned somethings about keyword searching. He said keyword researching brings something new and transformative. He also brought up the fact that when you keyword search it brings you a plethora of results, sorted by, date, newspaper page number, the section it appears in, and many more. 1. Gender was also an issue in digitization. The reason for this is because in the 19th century and early 20th-century newspaper editors were primarily male. Therefore, women did not get their say or free speech in any of the news that was published; because men dominated that industry.

Tony also brought up the fact that not everything is digitized. For example, a newspaper from the 1800s was not digitized. There are certain things you can gain and lose when you digitize a source. You can lose the original meanings conveyed by touch when you digitize something. To some people, it may lose its personal meaning or connection. The surrounding context is also lost. The reader loses the original reading experience which can make the text become less interesting to read. However, there are two things that are gained when you digitize a source. First, access is democratized. When something is democratized it means it is accessible to anyone; so anyone can go online and learn about the source without having to spend money or leave their house. It is a great way to spread information fast and conveniently. The second thing you gain is the spread of research. It enables others to come up with new research questions and lets them further the research. Overall, I learned a lot from Tony Guidone’s presentation and I am looking forward to gaining more knowledge in digitization.

Works cited: Milligan, Ian. “Illusionary Order” The Canadian Historical Review. https://muse-jhu-edu.mutex.gmu.edu/article/527016. Date Accessed 13th September 2019.

Blog post 1

Blog post 1

I have learned a lot this week about the New deal, great depression, and digital history. The stock market crash in October of 1929 was the major cause of the great depression. During the great depression, people were leaving in areas called “shanty towns” are “Hooverville’s”. These areas had horrible living conditions, and many did not survive. The term Hooverville’s comes from the president during the great depression and his name is Herbert Hoover. Obviously, as you can tell from the name “Hooverville’s” many people did not like what he was doing to try and help the great depression. The New Deal was created by President Franklin D. Roosevelt. The New deal was a series of programs that were able to help respond to the needs for relief, reform, and recovery from the great depression. It was also able to provide jobs for millions of people. I have also learned that digital humanities are the use of digital technologies and tools to ask questions, do research, hypothesize and analyze. I also know how humanities computing and digital humanities relate to each other. Humanities computing was the shift from computing with an emphasis on humanities. This led to digital humanities which are humanities that are inherently digital in design, form, and publication. I am looking forward to learning more about digital humanities and how it affects our technology today.

For this project, I was assigned “The garden of earthly delights” by Hieronymus Bosch. It is a modern title given to a triptych by the Dutch painter Hieronymus Bosch during the Northern Renaissance. Using Miriam Posner’s framework, we can understand the sources, the process, and the presentation of this digital project. “The garden of earthly delights” used sources from Northern Renaissance such as paintings by the painter Hieronymus Bosch. The main interest in this project is breaking down the painting “The garden of earthly delights” and understanding each part of the painting. In presenting this project they made an interactive version of the painting. It was visualized very well. There is a total of 9 panels they can click on and find out what that section is about and what it represents. Overall, they made this digital project very enjoyable, knowledgeable, and attractive to the public.

Works Cited

Dauterive, Jessica. “What is Digital Humanities?” https://slides.com/jdauteri/what-is-digital-humanities#/1 . Date Accessed 2nd  September 2019.

Hieronymus Bosch’s “Garden of Earthly Delights” – StoryMapJS – Northwestern University KnightLab. https://storymap.knightlab.com/examples/bosch-garden/. Date Accessed 2nd September 2019.

Posner, Miriam. “How did they make that?” UCLA Digital Humanitieshttp://jessicadoeshistory.com/cnd/exhibits/show/fall-2019/dh Date Accessed 2nd September 2019.

css.php