Mapping Colorado

I chose to do Tour #2 from the American Guide issue “Colorado: The Highest State”. It provides a detailed trip between Sterling, Colorado and the Continental Divide at Muddy Pass, Colorado. I chose it because Colorado has some of the most beautiful scenery in the United States, second only to Western Oregon in my opinion. (Although I am biased, I did spend a few years growing up in Oregon.) I had a thought that this trip wouldn’t be accessible for people of color who were traveling in Colorado, and unfortunately I was correct. The reality of travel in the Western United States in the mid twentieth century for anyone who wasn’t white, but specifically African American people, was that it was very difficult. You were not able to find lodging in the Green Book along the route for Tour #2 in this guide.

https://www.infoplease.com/atlas/north-america/united-states/colorado-map

My map for Tour #2

The available lodging on Tour #2 in Colorado

Segregation and racial bias affected the trips that were realistically available to African Americans in the United States. If there was nowhere for them to stay along the way on one of these American Guide tours, then it wasn’t realistic for them to go. Racial bias very much affected the flow of tourism, specifically in the South Western United States, because segregation limited the amount of tourists visiting. If a percentage of the population doesn’t have access to a site, then it’s only logical that traffic would be decreased. It’s incredibly frustrating to see this in 2019, and the thought that it was the norm makes me pretty angry.

I had actually heard of the Green Book before we discussed it in class, and I saw that fairly inaccurate movie titled Green Book. While the movie was not accurate to the lives of the men it was portraying, you did get an idea of how important the Green Book was as a guide 1 for African Americans from the 1930’s until the end of segregation. Learning how to use the site in class gave us a startling view of the reality of travel. As you can see in my screenshot above, there is nowhere to stay that follows the route of Tour #2. The closest and only place to stay is a hotel in Boulder, Colorado. I think it’s extremely important to be able to digitally map routes from the past, because it gives you a real world visual to draw from. Hearing about the lack of places to stay is one thing, actually seeing the spatial representation is very intense.

In Sarah Bond’s piece on mapping racism she states “People of color have been using maps to visualize racism for a long time.”2 Having spatial awareness and a visual track of just how sparse non-segregated hotels were in the 1940’s is a useful tool to exhibit just how difficult vacationing was for African Americans and people of color in the United States.
Blog Post 7

Automobile tours of American came about in the 1930s while the United States was struggling through the great depression. During the New Deal Era, the Works Progress Administration (WPA) undertook several projects. The largest and most known, being the Federal Writers Project. The American Guide Series was a series of books written as of the projects by the Federal Writers Project. It was a cooperative effort of State and Federal Organizations. Part tour guide and part almanac, these guide books were meant to encourage people to see America, to travel and move out west.3 Colored people have using similar books and maps for a very long time to visualize racism. The Green Book, a travel guide that listed hotels, restaurants, bars, etc. where black travelers would be welcome. This book helped many colored people who were traveling for work or vacation, get there safely and enjoy their time. “Many prominent African-American activists at the time turned to maps and other data visualizations in order to help the public–and even the president–to understand the detrimental effects of slavery on the country.” (Sarah Bond, 2017)4

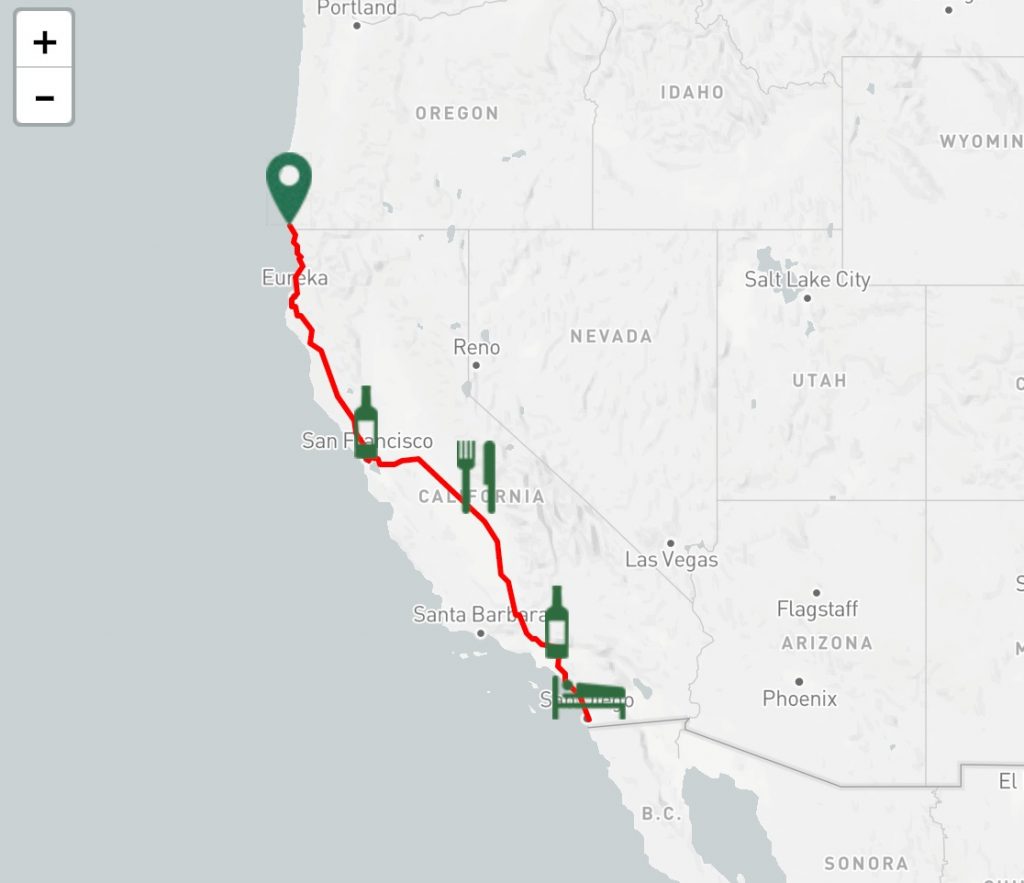
When choosing my tour for my map project I wanted to focus on a place that I have never been before. I wanted to be able to learn about a new place as well as learning about mapping. I chose to do the state of California. More specifically the coast of California. I’ve never been out west and do not know much about it. I also was curious as to how welcoming the west was to colored people. Since the west was developed later on, near the end of slavery, would it be easier or harder to travel there being colored? As I was mapping the points on my map, it was a little difficult to find information in the guide book about the stop itself. Most of what the guide book talked about was what came before and after the stops. It talked about the sites you see on the way to and from each stop. This caused most of the information I talked about in my map project to be about the surrounding areas. It was still very interesting. I also pulled photos from the web for each stop on the map. Once my map was complete, I took to The Green Book website. I entered my beginning point and my destination. The map it gave me was pretty bare. Not many restaurants or hotels that would except colored people. It was really shocking to see. Even though California was developed later on, the effects of slavery and segregation carried on from the east. This map also deviated from the coastal course given in the guide book. It took the trip further in-land through Fresno instead of through San Jose and Santa Barbara. https://uploads.knightlab.com/storymapjs/e2b1c65bcece3b107a43c7955431b69b/the-golden-state/index.html

The Green Book map of my tour.

“American Guide Series: The WPA Federal Writers’ Project: The Guides.” Research Guides. Accessed November 18, 2019. https://libguides.rowan.edu/c.php?g=248106&p=1653082.

Bond, Sarah. “Mapping Racism And Assessing the Success of the Digital Humanities.” History From Below, October 20, 2017. https://sarahemilybond.com/2017/10/20/mapping-racism-and-assessing-the-success-of-the-digital-humanities/.

Mapping Utah

This skill assignment was a great way to visualize the migratory nature of people in the 1930/40s.As we have already discussed, events such as the depression and dust bowl, affected the majority of Americans, but there were many other problems that affected specific minority groups which is shown through the Green Book Map. Of course, traveling can be difficult for anyone, but especially for minorities as they have to worry about where they are going and who they might encounter along the way.

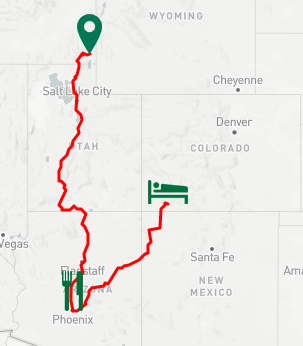
When comparing the tour I studied to a trip plotted using the Green Book project, I was initially shocked at how there were no available stops along the route. Upon reflection, I realized how naïve it was for me to even think otherwise.

The two nearest stops were completely of course in two different states, Arizona and Colorado. I lived in Utah for almost two years and the state is predominantly white. Of course, being white myself, it would be easy to forget this, but looking at the Green Book map puts into perspective just how difficult it must currently be and have been in the past to be a person of color in a state like Utah. Despite there being many tourist attractions in the state such as ski resorts, hiking, and other outdoor activities, there is still a lack of diversity. The Green Book Project is optimistic that “There will be a day sometime in the near future when this guide will not have to be published, that is when we as a race will have equal opportunities and privileges in the United States.”5 Unfortunately, that is clearly not the case. However, projects like the Green Book Map and The Colored Conventions Project bring awareness of these systemic racial issues and paves the way for improvement. In Sarah Bond’s article she quoted a professor that mentions “In the West, so many of the documents that record Black history have been devalued and discarded.”6 This statement, along with the Green Book map, show just how important it is to recognize our history and use these tools to learn from past mistakes and better the future, especially for minority groups.

Map Link: https://uploads.knightlab.com/storymapjs/548a98e68fd38f2bde679d15d69f1ba3/utah-a-guide-to-the-state/index.html

Blog Post 7: Mapping

Blog Post #7: (mapping)

Growing up in Philadelphia I had its history drilled into my head every year. Eventually I got tired and just stopped paying attention in history classes. This project though helped me learn about historical Philadelphia in a new way. Being able to plot the locations and make it all interactive made me want to learn compared to reading words in a textbook. Having visual aid to go along with the history makes it way easier to retain. Working with JS story maps, it helped me figure out exactly where each location was and the significance of that area.

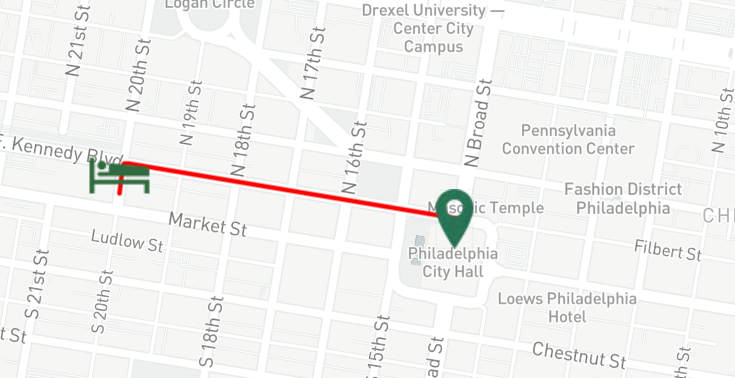
While looking through various versions of Green Book maps I noticed most of them had a cluster of sleeping and eating spots. Before inputting the route I wanted the map to follow I expected there to be a higher number of tourist locations. I choose center city for my Green Book map. Even though was typical for Northerns to not own slaves, Philadelphia had a big slavery number. There was not a lot of african american tourists in the Philadelphia area. But I do think the Philadelphia area became a popular tourist area because of the Anti-Slavery movements that started in this area.

Sites:

“Philadelphia, a Guide to the Nation’s Birthplace, Compiled by the Federal Writers’ Project, Works Progress Administration, for the Commonwealth of Pennsylvania : Federal Writers’ Project (Pa.) : Free Download, Borrow, and Streaming.” Internet Archive, [Philadelphia] William Penn Association of Philadelphia, 1 Jan. 1970, https://archive.org/details/philadelphiaguid00fedemiss.

Encyclopedia of Greater Philadelphia, https://philadelphiaencyclopedia.org/.

Mapping California

The guidebook I chose for this mapping assignment was “California: A Guide to the Golden State”. All of the options were within the United States. After looking through all of the options I thought California was my best option because we have learned about this specific state before, and how migrants traveled to California seeking new and better job opportunities. In the article “The Migrant experience” they mention why people left their homes and fled to California.”Driven by the Great Depression, drought, and dust storms, thousands of farmers packed up their families and made the difficult journey to California where they hoped to find work.” 7. A reason migrants came here was because of the nice temperatures allowed for a long growing season. However, Californians experienced the depression too so it was not as great as all the migrants thought it would be when arriving.

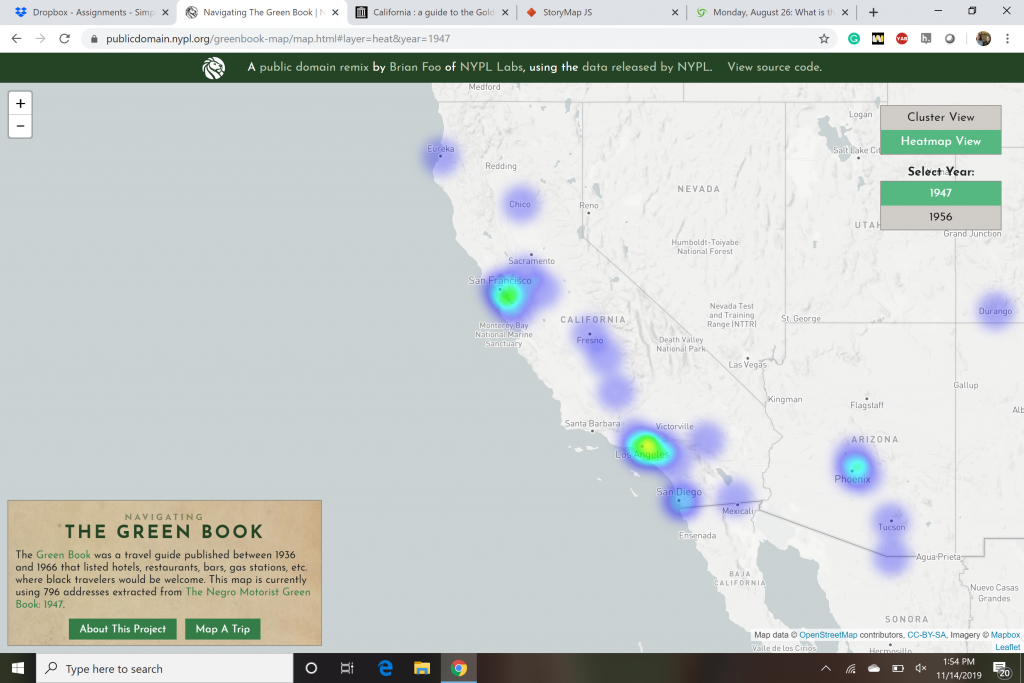
The tour I created from the guidebook was “Tour 5”. This tour passes through some key tourist sports in California, such as Lassen Volcanic National park, McCarthur Memorial State Park, Summit Lake, and many more. This tour focuses a lot in the northern part of California near places like Reno, Lassen, and the Plumas. It goes through all the popular spots for people to tour in this area. I compared my map to a heat map in the green book. In the California area in the green book, they had found 76 spots for where either restaurant, hotels, bars, or gas stations would be. I wanted to focus on the northern part of this map so it was comparable to my map. Once I started looking closer to the upper half of California there were about 17 spots marked. A lot of these places were hotels and tourist homes where people could stay for however kong they needed. Whereas my map mentioned a lot of lakes, gas stations, or national parks; it never really mentioned any tourist homes or hotels so that was one big difference I saw. Another difference I saw was the location, my map had a lot more spots in northern California, but the heat map only had a few and was focused more on the southern part of California.

Next, I want to briefly talk about how the experiences of black and white travelers are different or similar. I noticed that many of the icons that I looked at led me to a “The Negro-Motorist Green Book”. This makes sense because it is what the Green book is about. However, you could assume that the places black people had to stay were more run-down and not as nice because of the time period. Both races had many options for places to go, however, some of them were strictly for black people so that they were separated from white people. So there was some obvious segregation in that way. The maps did not give me much more information about racial bias and segregation in 1947. In the article “Mapping Racism And Assessing the Success of the Digital Humanities,” they talk a lot about how “people of color” have been using maps to visualize racism. “Many prominent African-American activists at the time turned to maps and other data visualizations in order to help the public–and even the president–to understand the detrimental effects of slavery on the country.”. 8.

Mapping and spatial history can educate us a lot about the past. From this assignment, I have learned about how we can see racial bias from a map which I really did not know was possible. This exercise also taught me about how we can view these primary sources in different ways just based on how they are spatially set up and they are telling us. For example, in the heat map, I was able to tell where things were located and what areas had more places marked than others. Certain cities had more hotels or restaurants than the next which would affect the population and amount of tourism in that area.

A heat map of California

https://storymap.knightlab.com/edit/?id=a-guide-to-the-golden-state

Going off the Road

Beginning this assignment, I immediately knew what state I wanted to look at. Maine has always interested me, so I thought this would be the perfect time to get my feet wet. The tour I chose was Tour #4, From Fort Kent to Mattawamkeag. Now the focus of these tours was mobility and creating a good sense of the state for tourists. This tour intrigued me because it sounded mostly “off-road.” Trails and canoeing down rivers were always mentioned at some point along the way. This tour was not for the faint of heart; rather, it was for those seeking sport. There was no road to simply drive down and sightsee, this route went through the woods and often junction with State Route 11 at certain points. I interpreted this as the writers wanting to show off the wilderness of the state, show what fun it has to offer in lush scenery and hard-working people.

The interesting thing about the tour is that it runs north to south almost in a straight line. Marguerite Shaffer’s See America First: Tourism and National Identity, 1880-1940 states that the federal workers wanted the tours to not be cyclical, but to go in the cardinal directions from state border to state border. 9

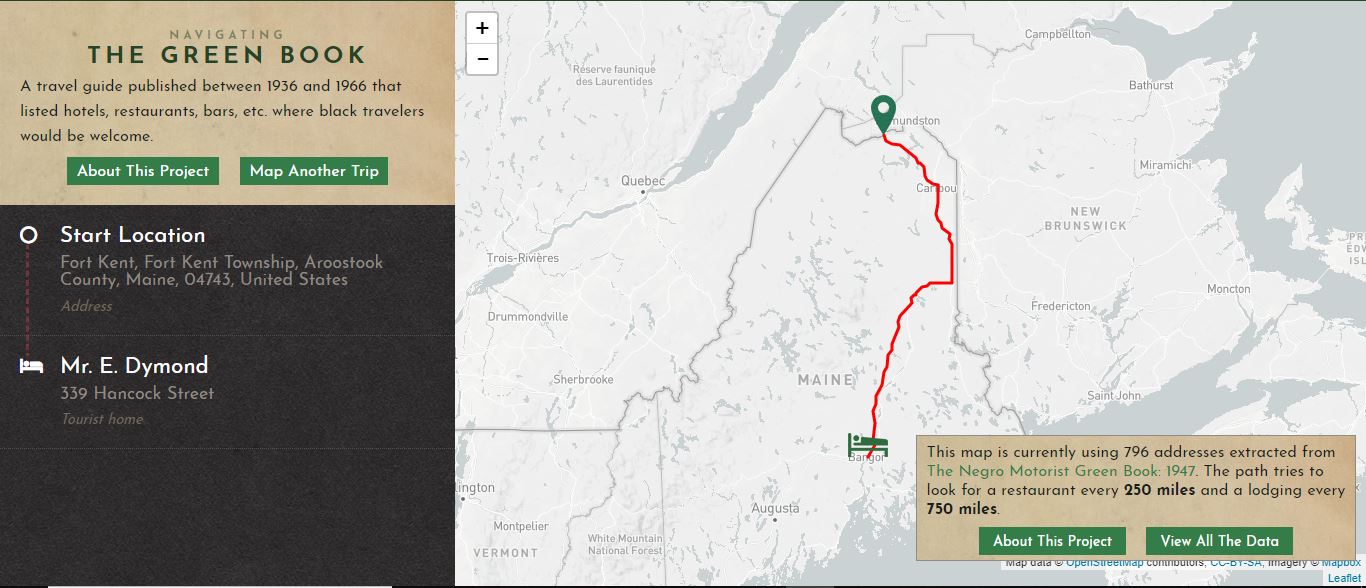
This tour offered many surprises when compared to the Negro’s Green Book project which compiles data about trips blacks took to safe spots for them in the past. Being that this tour was organized by the government and carried out by the state and local governments, this tour was mostly in the hands of White Americans. This image, screenshotted from Google Maps shows the general path of the Fort Kent-Mattawamkeag Tour. While traversable today, White Americans would most likely have enjoyed the thrill of the sporting events (hunting game and fishing) and taking to the wooded trails and canoeing. This map, created from The Green Book‘s data in the year 1947, shows a path that does not line up with the tour. What I feel this shows is that they (the Blacks at the time) would not travel through the forest trail or down State Route 11 to get to Bangor. This shows that these small towns might not have held the same importance to White Americans as it did to Blacks. Here, I think a historical bias could be drawn, but something else needs to be looked at first.
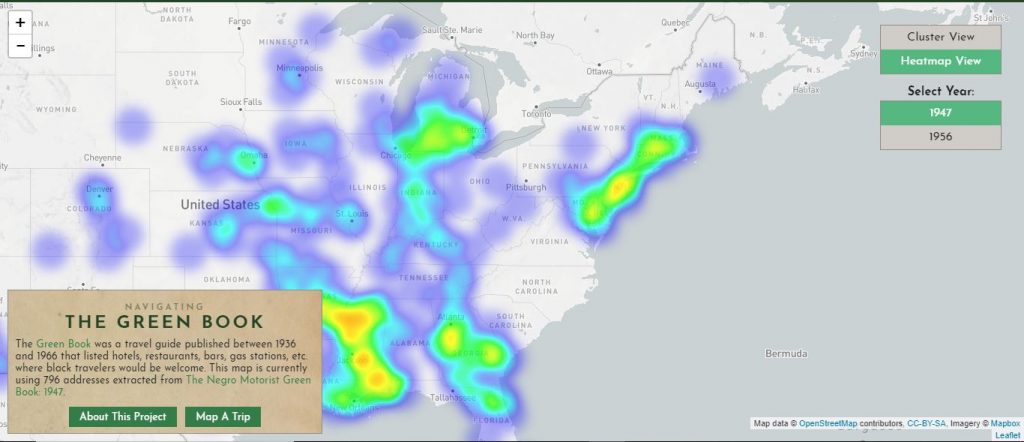
Heat Map (Density Map) showing the prominence of safe spaces for Blacks in the year 1946. This view is specifically of the East Coast and Midwest.

Using this heat map, it is easy to see that Blacks in Maine was not a common occurrence. There was only one rest stop available for them in the city of Bangor and not much else. No matter how I planned the trip, everything always ended back up at Bangor. So, concerning the historical bias 10 of the tour, nothing really reflects a racist attitude towards blacks as they were not a heavy presence. A lot of the major cities like New York, Chicago, and Atlanta are more densely populated by such locations that it makes sense as Blacks were more common to those regions.

By taking these tours and analyzing them both digitally and spatially, the goals of the FWP in writing the guides become apparent. Maine is rich in wildlife and game, making it a choice place to visit for hunting, fishing or for beginning a lumbering industry. The concept of wanting quasi-linear tours is also apparent. Maine has it all to get tourists coming to its forested frontiers. In a similar vein, The Green Book shows the racism of the times and the places blacks could go. It evinces a sense of a broken nation that really clashes with the goals the New Deal Administration wanted to bring in.

Mapping an American Guide Tour

Mapping and spatial history can tell us a lot about the past. Old roads that no longer exist, or towns that exist now but live where a forest once was brings historians to ask the question; why? Why is this road abandoned but not another one? Why did people choose this specific place to build a town and not a place a few miles away? Answering these questions gives us a deeper look into history and the decisions that led to the present day. The map I made was from Boston, MA to Tiverton, RI. This map is very specific to me because it actually goes through my hometown, Easton Massachusetts, and through a lot of towns I grew up around. I was surprised to see Easton on the route because I don’t consider it a very well known town, but it definitely adds a more personal element to my map and I was able to use a picture my mom had taken which I thought was a great addition. Reading through the guide about the towns around Easton, I was surprised at how little things had changed. Sharon still doesn’t have much and is more of a rich residential area, Blue Hills is still a beautiful hiking spot that but now they also have an animal sanctuary which include river otters, and Easton’s public library.Seeing how little things have changed there since the 1930’s was a little surprising, but I feel like I should’ve expected it since they’re very quiet towns and not much happens there. Washington officials wanted to guidebooks to be composed in exactly the same way, but some state directors rebelled, and one of those was Ray Allen Billington from Massachusetts who argued against the strict essays they were expected to write and instead wrote his own 10. When reading over what was actually written in the guide books, it’s not easy to tell to me, but maybe if someone was reading a lot  of the guidebooks, it would stick out more.

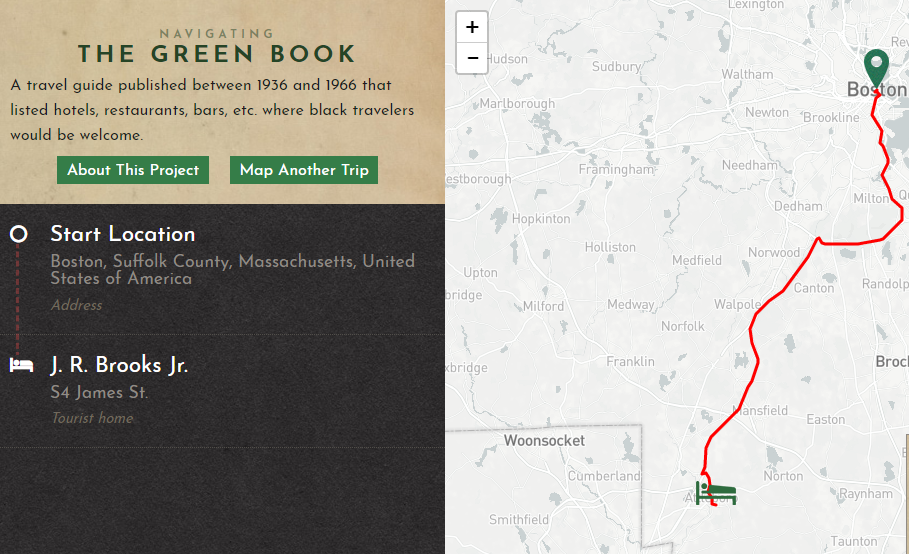
The route black travelers would have to take if they wanted to go from Boston, MA to Tiverton, RI.

When I looked at the trip through the Green Book map, it looked very different. There was only one rest stop for black travelers between the starting point and ending point, and when looking at the heat map, there were barely any in the area. It’s also the closest stop to Rhode Island, because there were no stops for black travelers at all in RI. Considering how many cultures and how diverse Rhode Island, and especially Providence, is today this isn’t a result I was expecting. The black travelers that would be taking this trip wouldn’t be able to stay where they wanted to go, they wouldn’t have many places to stay at all throughout the trip, and it would be a long way before they could even stop. This map helps highlight the racism that was prevalent at the time and can help the public better understand the history of racism and slavery 11. Not having a place to stay meant that not a lot of black people could explore America like their white counterparts, which meant that they couldn’t experience America like the guidebooks wanted Americans to be able to.

Mapping Tours – Christina O’Farrell

This exercise helped me gain knowledge on different locations throughout the United States and how mapping places/things digitally is quite simple. It makes me question how people used to use paper maps vs. digital ones on phones or a GPS. It proved to me that the advance in digitalizing maps and directions has made a lot of people’s lives much easier, and this tool really proved that.

Mapping/spatial history can teach us about different locations/landmarks/etc that existed and might have been replaced by newer things today. A lot of the places I mapped from my Colorado Guide were small towns that have grown into much bigger towns or different small trails that aren’t found on maps because they are so small. It was interesting to realize how locations back then may have been a bigger location in the past, compared to how people value them now. If they’re not on a map anymore now, I translated that as it now being an important place anymore or just not existing.

View of trip from Denver to Boulder.

The trip that I found from the Green Book project ran through many locations in Denver, Colorado and even had a rest stop in Boulder, Colorado. The trip that I had mapped ran through Boulder and the surrounding towns near it, so seeing that this trip had a rest stop in Boulder made sense to me. Many of the points I mapped in Boulder were small towns or resorts, so I translated that as it was clearly a very residential city and so were the towns/locations surrounding it.

Segregation and racial bias affect tourism because different parts of the country are viewed as being more racist than others. It’s a stereotype that white people from the south may hold older views towards segregation and racism versus other parts of the country such as the north. If someone followed that stereotype, they might avoid being a tourist somewhere in the south. My friends that are POC have even expressed this to me saying that it’s something they do consider when they travel to different locations. The article, “Mapping Racism and Accessing the Success of the Digital Humanities12 was a really great read and lets people be able to view racism in a different way. Letting people see it through a map takes a different approach and also raises awareness.

Another project we looked at that really caught my eye was the Mapping Inequality project. 13 The key it used to describe whether a part of a city is doing well with racism or bad is really interesting. I think using a map view versus someone just typing something out about a city brings a more interactive approach and makes people more interested to learn more.

I think by using this mapping tool it allowed me to get a better sense of how the country valued different locations differently than they do now. Also, incorporating the different mapping tools that showed segregation and racism was a really great approach and I think it’s a great tool for teachers to use to teach students about racism.

Tour.

Works Cited:

Mapping Inequality.” Digital Scholarship Lab. Accessed November 17, 2019. https://dsl.richmond.edu/panorama/redlining/#loc=11/42.593/-87.82&text=intro.

Mapping Racism And Assessing the Success of the Digital Humanities.” History From Below, October 20, 2017. https://sarahemilybond.com/2017/10/20/mapping-racism-and-assessing-the-success-of-the-digital-humanities/

Alaska

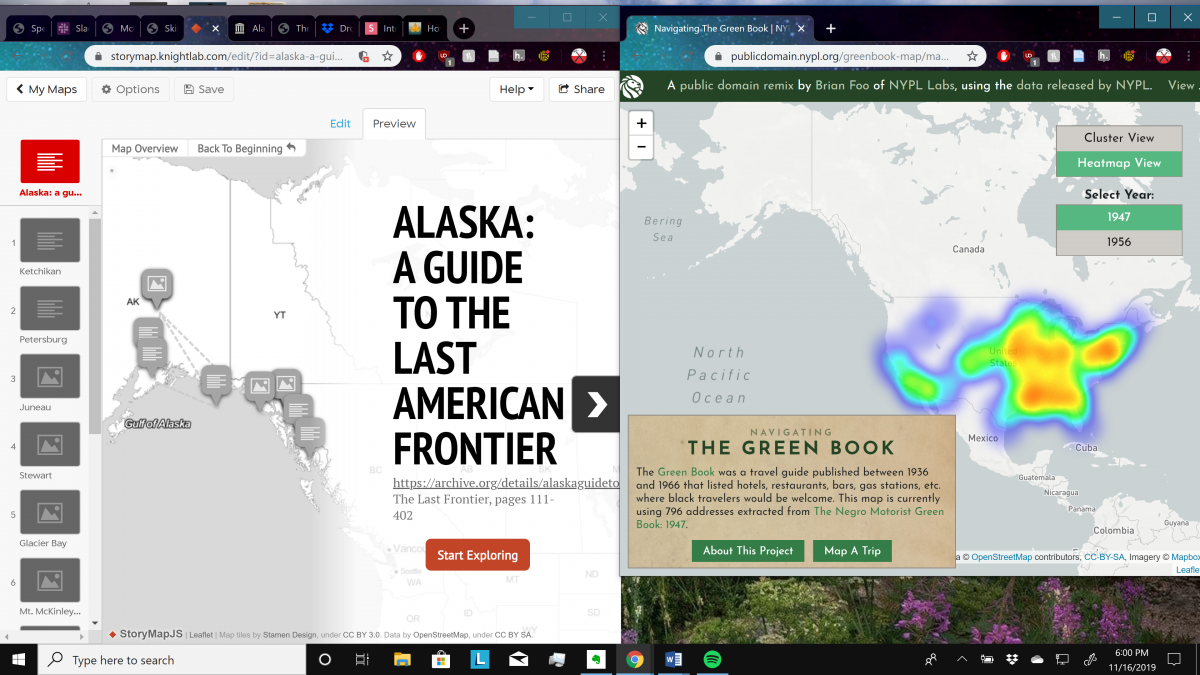
https://uploads.knightlab.com/storymapjs/5b0a1b53c05106520621c0f260f751f8/alaska-a-guide-to-the-last-american-frontier/index.html

What I planned for this project was to use the data of the Green Book Project to find out what mobile citizenship looked like in a place as remote and physical as Alaska, if there were accommodations for coloured hikers within the territory. However, the Green Book Project showed no data whatsoever outside of the mainland United States. This makes sense; in a state such as New York or Pennsylvania, you could take a tour and theoretically never leave your car. This is impossible in Alaska, due to the lack of roads. To access the capital, Juneau, even to this day you must take a ferry or a plane since there are no roads leading into it. Alaska is a destination attractive for its hiking, first and foremost, and one would be hard-pressed to drive there.

We can infer information about Alaska from similar states known for hiking and northern climates: Colorado and Washington, respectively. By the looks of the reports from the Mapping Inequality Project, it appears that black populations were not much more liberated there than in most of America; of one prominent black district in Denver, the surveyor writes, “For a Negro section, it is very well kept up. Were it not for the heavy colored population much of it could be rated ‘C’.” He rates every coloured section of Denver similarly. Regarding black residences in Seattle, the surveyor simply wrote “This is the Negro area of Seattle”, and ranked it a D. Considering the echoing ramifications of these reports, it seems reasonable that black people were precluded from the free time and capital required for serious hiking. 14

The improved mobile citizenship the Green Book promised in the 1940s did not apply to a more active brand of tourism. One look at the Green Book Project, and one can see that lodging for the more mountainous regions is sparse, ranging from five in Colorado to one in Montana and none in Washington. I believe that a perfect storm of decreased institutions for black people (evident in low coloured populations in those areas) and simple incapability of travel to mountainous locales led to this dearth of trail lodging in popular hiking destinations, conclusions which can be extended to Alaska.

By all means, mountain hiking was restricted to white tourists. Tourism as the “ritual of citizenship” so cherished by many would be null and void when it came to experiencing natural wonders up close, excluding me from the beauty of the country I want to be a part of. If I were a black traveller, the infrastructure simply would not be there to preserve me from humiliation and discomfort were I to hike in Alaska. This wouldn’t be just nothing, as “the 1930s might best be characterised by a pervasive interest in culture… the more anthropological concept of culture denoted by a shared set beliefs and behaviours”– and the pool of these shared beliefs and behaviours would shrink all the more with my myopic access to hiking in America. 15

Omaha: For God and Country

Although high school to many of us may seem like a far off dream, I remember my time in secondary school very well thanks to one man – Mr. Stulac. My Latin teacher was very proud of the places he had lived. One of these places was Nebraska. I would often tease him for his pride in inhabiting in such a strange place, but Mr. Stulac informed me that this state surface-level appearance by no means compared to the wonderful of this state.

For this project, I wanted to test my high school Latin teacher’s beliefs. Is Nebraska, the “cornhusker state”, really as remarkable as he claimed?

For this project I examined Tour 1A. Omaha-Bellevue in the WPA’s Nebraska: The Cornhusker State. A majority of the sites listed in this tour pertained to the area’s natural landscape, missionary practices, and governmental history. Considering these landmarks through the eyes of an American living in the 21st century, it’s difficult to understand the significance of these places. However, when perceived through the eyes of an American living during the Great Depression, these sites take on a new meaning.

With regards to the area’s natural wonders, many Americans during the 1930s sought to assign new value in their culture and have it hold its own against those of Europe. As is explained in American Culture Defined: The American Guide Series16, Americans valued their landscapes as works comparable to those created in Europe. This was a bold endeavor, but one which has benefited our nation’s National Parks Services, from Yosemite to the small Fontenelle Forest in Bellevue, Nebraska.

Additionally, the WPA’s Nebraska: A Guide to the Cornhusker State provides readers with information on road conditions and means of transportation around the city. This information is significant, as it encouraged tourists to travel across the state as individuals through the use of the automobile. This sense of empowerment given to the average American was much needed during the hopeless time of the Great Depression.

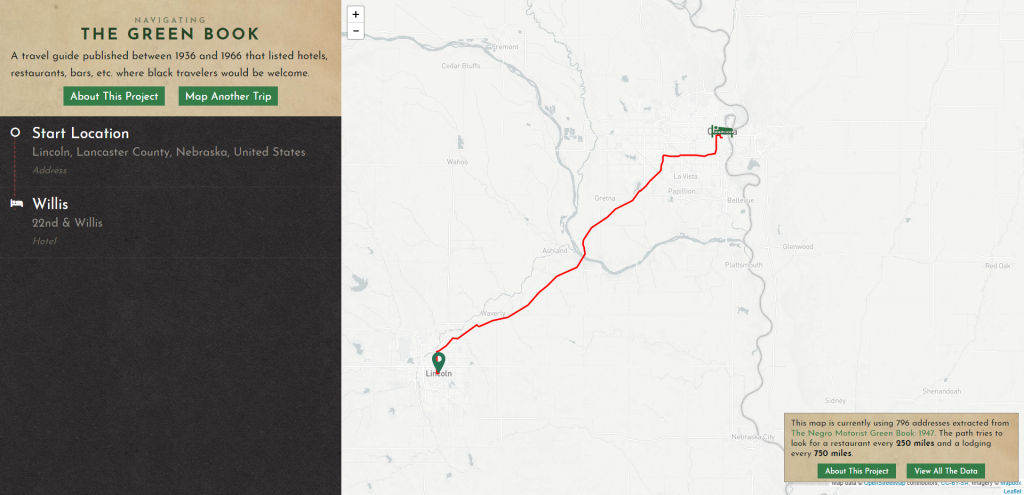
However, this does not mean that the WPA’s guide series empowered all Americans. For African Americans living during the time of Jim Crow, travel was a daunting task: Where will my family rest safely at night? Where can I find my family a decent meal? These questions plagued African Americans considering a tour of their own nation, and the answers were bleak. The map below shows the places an African American’s business would have been accepted on a journey from Lincoln to Omaha.

As we can see, the options were scarce, and African Americans were excluded from this opportunity provided by the Roosevelt Administration. In Sarah Bond’s article “Mapping Racism and Assessing the Success of the Digital Humanities,”[enf_note] https://sarahemilybond.com/2017/10/20/mapping-racism-and-assessing-the-success-of-the-digital-humanities/[/enf_note] mapping projects such as the Navigating the Green Book provide audiences with a clear image of the presence of discrimination. What could be more frightening than the insecurity of one’s safety.

Ultimately, I believe that Mr. Stulac was right in saying that Nebraska was an interesting place to live. Behind the stern face of the cornhusker lies a past filled with American nationalism and racial bigotry.

css.php